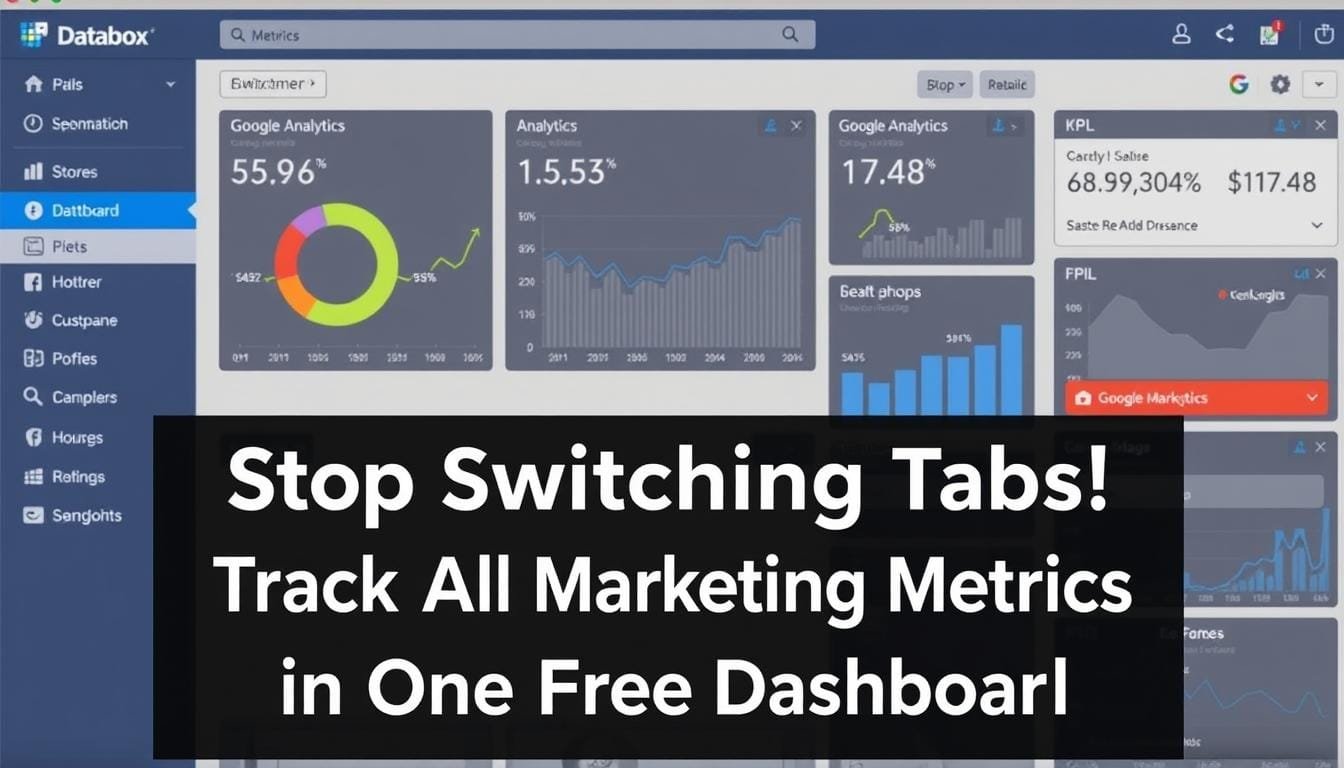
That frustrating juggling act ended when I discovered Databox. This powerful platform has transformed how I track and analyze my marketing performance by bringing all my critical metrics into one centralized, easy-to-understand dashboard – and the best part? I started with their completely free plan.
What Makes Databox Unique?
In a sea of analytics tools, Databox stands out for several reasons. Unlike many competitors that lure you in with a “free trial” only to cut you off after 14 days, Databox offers a genuinely free forever plan that delivers substantial value without requiring your credit card information.

Cross-Platform Integration That Actually Works
The true power of Databox lies in its ability to seamlessly connect with over 70 popular marketing tools and platforms. Whether you’re tracking website performance in Google Analytics, managing ad campaigns on Facebook, or nurturing leads in HubSpot, Databox pulls all this data into one cohesive dashboard.

Real-Time Updates When You Need Them
Unlike static reports that quickly become outdated, Databox provides real-time updates across all your connected platforms. This means you’re always looking at the most current data, allowing you to make timely decisions and adjustments to your marketing strategies.
Free Forever Plan
Start with 3 data sources, basic dashboards, and daily refreshes without ever paying a cent.
70+ Integrations
Connect all your essential marketing tools from social media to email, SEO, and advertising platforms.
Real-Time Insights
See your latest performance data refreshed automatically so you’re never working with outdated information.
Key Features That Make Marketers’ Lives Easier
Databox isn’t just about consolidating your data – it’s about making that data actionable and easy to understand. Here are the features that have transformed how I manage my marketing metrics:
Drag-and-Drop Dashboard Builder
Even with zero technical skills, you can build professional-looking dashboards in minutes. The intuitive drag-and-drop interface lets you select exactly which metrics matter most to your business and arrange them however you prefer.

Pre-Built Templates for Instant Insights
Don’t want to build dashboards from scratch? Databox offers dozens of pre-built templates for specific marketing needs – from social media performance to SEO tracking, PPC campaign monitoring, and more. Just select a template, connect your data sources, and you’re ready to go.
Automated Reports Delivered to Your Inbox
Set up scheduled reports to be automatically delivered to your inbox (or your client’s or boss’s inbox) on a daily, weekly, or monthly basis. These beautiful, professional reports can be downloaded with just one click, saving you hours of manual reporting work.

Ready to centralize your marketing metrics?
Join thousands of marketers who have simplified their analytics with Databox’s free dashboard.
How to Set Up Your Free Databox Dashboard in 5 Minutes
Getting started with Databox is surprisingly simple. Follow these steps to have your marketing metrics dashboard up and running in less than five minutes:

- Step 1: Create your free account – Visit Databox.com and click “Sign Up Free.” Enter your email, create a password, and you’re in. No credit card required.
- Step 2: Connect your data sources – Select from 70+ integrations including Google Analytics, Facebook, HubSpot, or any other platforms you use. Authentication is usually just a few clicks.
- Step 3: Choose your metrics – Select which specific metrics you want to track from each connected platform. This is where you decide exactly what data matters most to your business.
- Step 4: Select a dashboard template – Choose from pre-built templates designed for specific marketing needs or create your own custom dashboard.
- Step 5: Customize your view – Arrange your metrics, adjust time periods, and personalize your dashboard to match your reporting preferences.

Once set up, your dashboard will automatically refresh with the latest data from all your connected platforms. You can access it anytime from any device, share it with team members, or schedule automated reports to be delivered to stakeholders.
Real-Life Use Cases: How I Use Databox Daily
Databox has transformed how I approach marketing analytics in several key areas. Here are some of the ways I use it to make better decisions:
Social Media ROI Tracking
Instead of guessing which social platforms drive actual results, I now track complete funnel metrics from impressions to engagement to conversions across all channels in one view. This has helped me reallocate my social media budget to the platforms that actually drive business results.

SEO Performance Monitoring
By combining Google Search Console and Google Analytics data in one dashboard, I can see exactly how organic traffic is trending, which keywords are performing best, and how that translates to actual conversions – all without switching between tools.

Ad Spend Optimization
With all my advertising platforms connected to Databox, I can quickly identify which campaigns, ad sets, and individual ads deliver the best cost per acquisition. This has helped me reduce wasted ad spend by over 30% while maintaining the same conversion volume.
Content Marketing Effectiveness
By tracking not just pageviews but engagement metrics, time on page, and conversion paths, I can see which content topics and formats actually drive business results rather than just vanity metrics.
Before Databox
- Spent 5+ hours weekly creating reports
- Constantly switching between platforms
- Often working with outdated data
- Struggled to connect metrics to business outcomes
After Databox
- Automated reporting saves 4+ hours weekly
- All metrics visible in one dashboard
- Real-time data for timely decisions
- Clear connection between marketing efforts and results
Stop Drowning in Data and Start Making Better Marketing Decisions
The days of jumping between platforms, manually compiling reports, and trying to make sense of disconnected marketing data are over. With Databox’s free plan, you can centralize your most important metrics in one place, saving time and gaining clearer insights into what’s actually working in your marketing.

Whether you’re a solo marketer, part of a growing team, or an agency managing multiple clients, Databox offers a solution that scales with your needs – starting with a completely free plan that delivers genuine value.
Ready to simplify your marketing analytics?
Join thousands of marketers who have transformed their reporting with Databox’s free dashboard.