Like many store owners, I’d been relying on Shopify’s native analytics and basic Google Analytics data. I thought I had a decent grasp on what was working. Turns out, I was tracking all the wrong metrics and missing the real story behind my sales.
3 Key Metrics Only Glew.io Surfaces for Shopify Stores
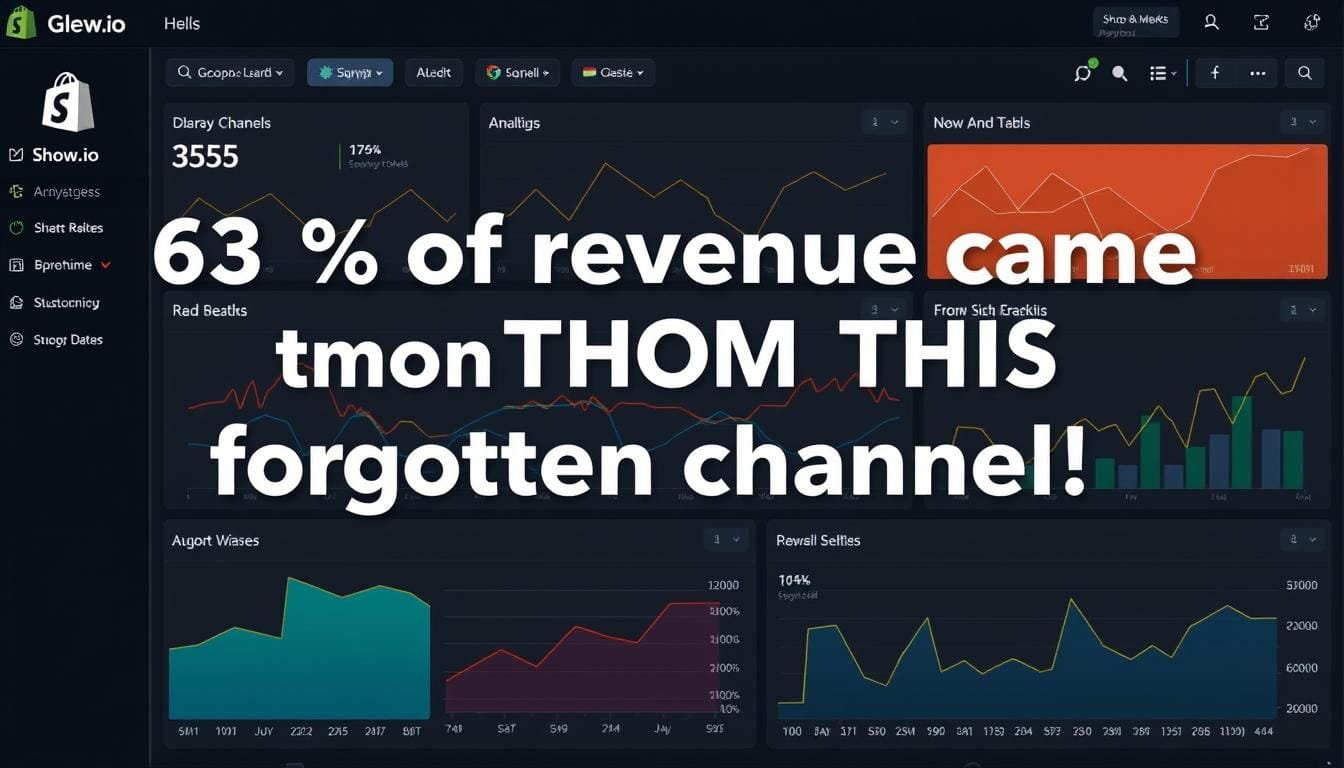
When I first connected Glew.io to my Shopify store, I expected to see the same data I was already getting—just presented differently. What I got instead were insights I never knew existed. Here are three game-changing metrics that Glew.io surfaced that I couldn’t find anywhere else:
1. True Customer Lifetime Value by Acquisition Source
I knew my overall customer lifetime value, but Glew.io broke it down by exactly where those customers came from. This wasn’t just “Facebook” or “Google”—it was specific campaigns, ad sets, and even individual ads. The difference was shocking.

What I discovered: Customers from my Instagram campaigns had a lifetime value 2.3x higher than those from Facebook, despite Facebook showing more initial conversions. I’d been optimizing for first purchases, not long-term value.
2. Product Affinity Scores
Glew.io showed me which products were frequently purchased together—not just in the same cart, but across a customer’s entire purchase history. This revealed patterns I never would have spotted manually.

What I discovered: Customers who purchased our entry-level product were 4x more likely to upgrade to our premium line if they also bought a specific accessory first. This insight alone helped me create bundles that increased our average order value by 28%.
3. Abandoned Cart Patterns
Most analytics tools show abandoned cart rates. Glew.io showed me exactly where in the journey different customer segments were dropping off—and why.

What I discovered: Mobile users from paid social were abandoning at the shipping information page at 3x the rate of other visitors. After fixing a mobile-specific form issue, we recovered over $12,000 in previously lost sales in just one month.
| Metric | Native Shopify Analytics | Glew.io Analytics |
| Customer Lifetime Value | Store average only | Segmented by channel, campaign, product, and cohort |
| Product Relationships | Basic “also bought” data | Detailed affinity scores across purchase history |
| Abandoned Carts | Total abandonment rate | Segment-specific dropout points with behavioral patterns |
| Attribution | Last-click only | Multi-touch with customizable models |
| Reporting Customization | Limited to preset reports | Fully customizable dashboards and automated reports |
How Customer Journey Mapping in Glew.io Exposed My Real Conversion Drivers
Before Glew.io, I thought I understood my customer journey. I was wrong. What Glew.io revealed through its journey mapping changed my entire marketing strategy.

The most eye-opening discovery was that my average customer interacted with 5.3 touchpoints before making a purchase—not the 1 or 2 I had assumed. Even more surprising was which touchpoints were actually driving decisions:
What I Thought Was Working
- Facebook ads (last-click attribution)
- Google Shopping campaigns
- Homepage banner promotions
- Influencer discount codes
What Was Actually Working
- Educational blog content (first-touch for 42% of sales)
- Abandoned cart emails (3.2x more effective than I thought)
- Product comparison pages
- Customer review sections
Glew.io’s attribution models showed me that while Facebook ads were often getting credit for conversions, they were rarely starting the customer relationship. Our blog content was actually initiating 42% of our successful customer journeys—content I had considered cutting because I couldn’t directly attribute sales to it.

Stop Guessing What’s Driving Your Shopify Sales
Discover your true conversion drivers with Glew.io’s multi-touch attribution and customer journey mapping. Get insights you can’t find in Shopify’s native analytics.
Surprising Traffic Sources I Doubled Down On (With Geo-Maps from Glew)
One of the most valuable features in Glew.io is its ability to map traffic and conversions geographically. This revealed unexpected pockets of high-converting traffic I never would have discovered otherwise.

While my marketing had been targeting major urban centers, Glew.io showed that some of my highest-converting traffic was coming from unexpected places:
- Mid-sized cities in the Midwest were converting at 4.2x my store average
- International traffic from Australia had the highest average order value—despite no targeted marketing
- Mobile traffic from Pinterest was driving highly-qualified visitors specifically for one product category
Based on these insights, I reallocated 30% of my ad budget to these high-performing but previously overlooked segments. The results were immediate:

Another revelation came from comparing mobile and desktop conversion patterns. While our desktop site was performing well, mobile users were struggling with specific elements. Glew.io’s heatmaps showed exactly where the friction points were, allowing us to optimize the mobile experience for our highest-value traffic sources.
Product Combinations I Never Would’ve Discovered Without Cross-Sell Reports
Perhaps the most profitable insight from Glew.io came from its cross-sell and product affinity reports. These revealed purchase patterns that weren’t obvious from looking at individual transactions.

Here are three abandoned cart patterns Glew.io detected that led to immediate improvements:
Pattern #1: The Price Shopper
Customers who added our premium product to cart, visited the economy version, then abandoned altogether.
Solution: Added a side-by-side comparison table highlighting the value of the premium version, reducing abandonment by 23%.
Pattern #2: The Shipping Threshold
Customers who abandoned when they were $5-15 away from free shipping threshold.
Solution: Added smart popups showing exactly how much more needed for free shipping, increasing AOV by 18%.
Pattern #3: The Bundle Hesitation
Customers who added individual items that would be cheaper as a bundle, then abandoned.
Solution: Implemented automatic bundle suggestions, recovering 31% of these abandoned carts.
Beyond cart abandonment, Glew.io revealed product combinations that customers frequently purchased—but across multiple orders rather than in a single transaction. This insight led us to create targeted cross-sell campaigns that increased repeat purchase rate by 27%.

5 Actionable Tips for Configuring Sales Attribution Models in Glew.io
- Start with a time-decay model if you have a longer sales cycle to properly credit touchpoints based on when they occurred
- Create separate models for new vs. returning customers as their journeys and influential touchpoints differ significantly
- Adjust attribution windows to match your typical consideration period (30 days works for most Shopify stores)
- Include offline touchpoints by importing custom events for a complete view of the customer journey
- Compare multiple models side-by-side to identify consistent high-performers across different attribution scenarios
Action Steps to Replicate These Insights in Your Shopify Store
The revelations from Glew.io completely transformed how I run my Shopify store. Here’s how you can replicate these insights for your business:
Step 1: Connect Your Data Sources
Start by integrating Glew.io with your Shopify store, marketing platforms, and customer service tools for a complete data picture.

Step 2: Configure Your Attribution Model
Set up a multi-touch attribution model that reflects your customer journey and gives appropriate credit to each marketing touchpoint.

Step 3: Create Custom Dashboards
Build dashboards focused on the metrics that matter most to your business goals, whether that’s customer acquisition, retention, or lifetime value.

Uncover Your Shopify Store’s Hidden Sales Drivers
Stop guessing what’s working in your Shopify store. Get accurate, actionable insights with Glew.io’s comprehensive sales analytics platform. Set up takes less than 15 minutes.
The difference between struggling and thriving often comes down to having the right data to make decisions. For me, Glew.io was the missing piece that finally showed me what was actually driving sales in my Shopify store—and it can do the same for you.