Introduction to Google Analytics in 2025
Google Analytics is a free web analytics service that tracks and reports website traffic. In 2025, it has become an indispensable tool for website owners, marketers, and businesses of all sizes. The platform provides detailed insights into how users find and interact with your website, helping you understand what’s working and what needs improvement.
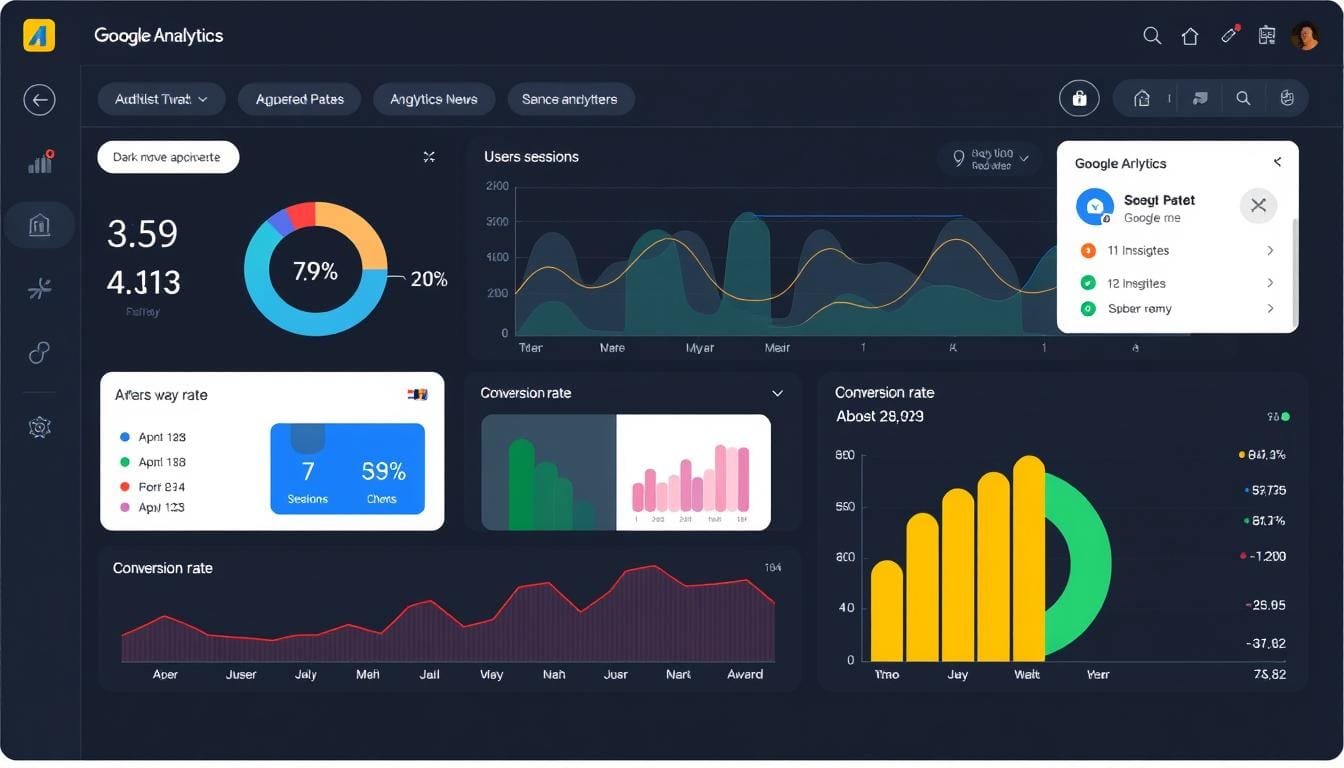
The Google Analytics 2025 dashboard provides a comprehensive overview of your website’s performance
The 2025 version of Google Analytics builds upon the event-based model introduced with GA4, but with significant improvements in user experience, predictive capabilities, and privacy compliance. Whether you’re running a blog, e-commerce store, or corporate website, Google Analytics offers invaluable data to help you optimize your online presence.
Key Benefits of Google Analytics in 2025
- Real-time tracking of user behavior across devices
- Comprehensive audience insights and segmentation
- Detailed conversion tracking and attribution
- Enhanced privacy controls compliant with global regulations
- Seamless integration with other Google products
- AI-powered insights and recommendations
- Customizable dashboards and reports
- Cross-platform tracking (web, mobile, app)
- Predictive analytics for future performance
- Advanced event tracking capabilities
What’s New in Google Analytics 2025
The 2025 version introduces several groundbreaking features that make analytics more accessible and actionable for beginners:
Predictive Traffic Trends
Using advanced AI, Google Analytics now forecasts traffic patterns with remarkable accuracy, helping you prepare content and campaigns for peak periods.
Automated SEO Audits
The platform now automatically analyzes your content performance against search trends, providing actionable recommendations to improve visibility.
Behavioral Intent Analysis
New machine learning algorithms can now predict user intentions based on behavior patterns, helping you optimize conversion paths.
Account Creation & Property Setup
Setting up Google Analytics for your website is straightforward, even for beginners. Follow these steps to create your account and configure your first property.
Step 1: Create a Google Analytics Account
- Go to analytics.google.com and sign in with your Google account
- Click “Start measuring” to begin the setup process
- Enter an account name (typically your business name)
- Configure data sharing settings according to your preferences
- Click “Next” to proceed to property setup
Step 2: Set Up Your First Property
A property in Google Analytics represents your website or app. Here’s how to set it up:

The property setup wizard guides you through configuring your website tracking
- Enter a property name (usually your website name)
- Select your reporting time zone and currency
- Choose your industry category and business size
- Select how you intend to use Google Analytics
- Click “Create” to generate your property
Step 3: Set Up Data Streams
Data streams are sources from which Google Analytics collects data. For a website, you’ll need to set up a web stream:
- In your property settings, navigate to “Data Streams”
- Select “Web” as your platform
- Enter your website URL and stream name
- Enable enhanced measurement if you want to automatically track page views, scrolls, outbound clicks, site search, video engagement, and file downloads
- Click “Create stream” to generate your tracking ID
Get Started Faster with Our Setup Template
Skip the guesswork and ensure you’ve configured everything correctly with our step-by-step Google Analytics 2025 setup template.
Step 4: Install the Tracking Code
To collect data, you need to add the Google Analytics tracking code to your website. There are two primary methods:
Method 1: Direct Code Implementation
Copy the tracking code from your web stream settings and paste it into the <head> section of every page on your website. If you’re using a content management system like WordPress, you can use a plugin or theme settings to add this code site-wide.
Method 2: Using Google Tag Manager (Recommended)
Google Tag Manager provides a more flexible way to manage tracking codes:
- Create a Google Tag Manager account at tagmanager.google.com
- Set up a container for your website
- Add the Google Tag Manager code to your website
- Create a Google Analytics tag in Tag Manager using your Measurement ID
- Set the trigger to fire on all pages
- Publish your container
Pro Tip: Google Tag Manager makes it easier to add, modify, or remove tracking codes without changing your website code. It’s especially useful as you become more advanced with analytics and want to track custom events.
Navigating the 2025 Interface
The Google Analytics interface has been redesigned in 2025 to be more intuitive and user-friendly. Understanding the layout will help you navigate efficiently and find the insights you need.
Dashboard Overview
When you first log in, you’ll see the Home dashboard with an overview of key metrics. The interface is organized into several main sections:
The real-time report shows you what’s happening on your website right now
Left Navigation Menu
- Home: Overview dashboard with key insights
- Reports: Detailed reports organized by user lifecycle
- Explore: Custom analysis tools for deeper insights
- Advertising: Campaign performance metrics
- Configure: Settings for events, conversions, and audiences
- Admin: Account and property management
Main Content Area
- Report Header: Date range selector and comparison tools
- Visualization Area: Charts and graphs of your data
- Data Tables: Detailed metrics in tabular format
- Insights Panel: AI-generated observations and recommendations
- Customization Options: Tools to adjust report views
Reports Organization
The Reports section is organized around the user lifecycle, making it easier to analyze different stages of user interaction:
- Acquisition: How users find and arrive at your site
- Engagement: How users interact with your content
- Monetization: How your site generates revenue
- Retention: How users return to your site over time
- User: Demographic and technical information about your audience
New Interface Features in 2025
The 2025 version introduces several interface improvements:
Contextual Help
Hover over any metric or chart to see a plain-language explanation of what it means and how it can be used.
Personalized Navigation
The interface learns from your usage patterns and prioritizes the reports and metrics you access most frequently.
Voice Commands
Ask questions in natural language to generate reports and insights without navigating through menus.
Key Metrics for Beginners
Understanding the essential metrics will help you make sense of your data without feeling overwhelmed. Here are the most important metrics to focus on as a beginner:
User Metrics
- Users: The number of unique individuals who visited your site
- New Users: First-time visitors to your site
- Active Users: People who actively engaged with your site
- Sessions: Total number of visits to your site
- Sessions per User: Average number of sessions per individual
- Average Session Duration: How long users typically stay on your site

The audience demographics report helps you understand who your visitors are
Engagement Metrics
- Engagement Rate: Percentage of sessions that were engaged (not bounced)
- Engaged Sessions: Sessions that lasted longer than 10 seconds, had 2+ page views, or had a conversion event
- Average Engagement Time: The average time users actively engaged with your content
- Views per Session: Average number of pages viewed during a session
- Most Engaged Pages: Pages with the highest engagement time
- Scroll Depth: How far down your pages users typically scroll
Acquisition Metrics
- Traffic Source: Where your visitors came from (e.g., organic search, social media, direct)
- Referral Path: The specific websites that sent traffic to you
- Campaign Performance: How your marketing campaigns are performing
- Search Terms: Keywords users searched for to find your site
- Landing Pages: The first pages users see when visiting your site
- User Acquisition: How new users are finding your site
Conversion Metrics
Conversions are specific actions you want users to take on your site, such as making a purchase, signing up for a newsletter, or filling out a contact form.
- Conversion Rate: Percentage of sessions that resulted in a conversion
- Conversions: Total number of completed conversion actions
- Conversion Value: The monetary value of conversions (if applicable)
- Goal Completions: Number of times users completed specific goals you’ve set
Master the Metrics That Matter
Get our printable Google Analytics 2025 Metrics Cheat Sheet to keep the most important metrics at your fingertips.
Interpreting Reports
Now that you understand the key metrics, let’s explore how to interpret the most useful reports for beginners.
Real-Time Report
The Real-Time report shows what’s happening on your website right now. It’s particularly useful when you’ve just published new content or launched a campaign and want to see immediate results.
- What to look for: Spikes in traffic, which pages are being viewed, and where visitors are coming from
- How to use it: Monitor the immediate impact of social media posts, email campaigns, or other promotional activities
Acquisition Overview
This report helps you understand how users are finding your website.
- What to look for: Your top traffic sources and how they compare in terms of engagement and conversions
- How to use it: Identify which channels are most effective at bringing valuable traffic to your site and invest more in those channels
“Don’t just collect data—connect data. Look for relationships between traffic sources and user behavior to understand the complete customer journey.”
Engagement Reports
These reports show how users interact with your content once they’re on your site.
Pages and Screens Report
- What to look for: Your most viewed pages, pages with the highest engagement time, and pages with the highest exit rates
- How to use it: Identify your most popular content to create similar content, and find underperforming pages that need improvement
Events Report
- What to look for: The most common user interactions on your site, such as button clicks, video plays, or form submissions
- How to use it: Understand which elements of your site users engage with most and optimize those elements for better performance

The custom event configuration panel allows you to track specific user interactions
User Reports
These reports provide insights into who your users are and what technologies they use to access your site.
Demographics and Interests
- What to look for: Age, gender, and interest categories of your audience
- How to use it: Tailor your content and marketing to match the preferences of your actual audience
Technology and Device
- What to look for: Browsers, operating systems, and devices used to access your site
- How to use it: Ensure your site works well on the most common devices and browsers used by your audience
Using Comparison and Date Ranges
To get more context for your data, use the comparison feature to see how your metrics change over time or across different segments:
- Select a date range for your report (e.g., the past 30 days)
- Click “Compare” and select a previous period (e.g., previous 30 days)
- Look for significant changes in key metrics
- Investigate what might have caused those changes
Advanced Tips for Beginners
Once you’re comfortable with the basics, these more advanced features can help you get even more value from Google Analytics.
Setting Up Conversions
Conversions help you track specific actions that are important to your business goals:
- Go to Configure > Events in the left navigation
- Find an existing event you want to track as a conversion (e.g., “purchase” or “form_submit”)
- Toggle the “Mark as conversion” switch to ON
- Alternatively, create a new conversion by clicking “Create conversion” and defining the parameters
Creating Custom Reports
The Explore section allows you to create custom reports tailored to your specific needs:
- Go to Explore in the left navigation
- Choose a template (e.g., Free form, Funnel exploration, Path exploration)
- Select dimensions (categories of data) and metrics (measurements) for your report
- Apply segments to focus on specific user groups
- Save your exploration for future use
Leveraging AI-Powered Insights
Google Analytics 2025 includes powerful AI features that automatically surface insights you might miss:
- Anomaly Detection: Automatically identifies unusual patterns in your data
- Predictive Metrics: Forecasts future behavior based on historical data
- Insight Stream: Provides a feed of observations and recommendations
- Natural Language Query: Ask questions about your data in plain English
2025 Feature Highlight: The new “What If” scenario modeling allows you to simulate changes to your website or marketing strategy and see predicted outcomes before implementing them.
Integrating with Other Google Tools
Connect Google Analytics with other Google tools for a more comprehensive view of your digital presence:
Google Search Console
Link your Search Console account to see which search queries bring users to your site and how your pages perform in search results.
Google Ads
Connect your Google Ads account to track the performance of your advertising campaigns and optimize your ad spend based on conversion data.
Take Your Analytics to the Next Level
Download our Google Analytics 2025 Custom Dashboard Template to instantly visualize your most important metrics.
Privacy and Compliance in 2025
Google Analytics has evolved to address growing privacy concerns and regulations worldwide. Understanding these features is essential for compliant data collection.
Key Privacy Features
- Cookieless Measurement: Google Analytics 2025 can now track user interactions without relying on cookies, using machine learning to fill data gaps
- Data Retention Controls: Set how long user-level data is stored before being automatically deleted
- Consent Mode: Adjust data collection based on user consent choices
- IP Anonymization: Automatically anonymizes user IP addresses
- Data Deletion Requests: Tools to help you comply with user requests to delete their data
Compliance Best Practices
- Update your privacy policy to disclose your use of Google Analytics
- Implement a consent management platform if you operate in regions with strict privacy laws
- Use Google’s Consent Mode to respect user preferences
- Regularly review and update your data retention settings
- Consider using Google Analytics’ data redaction features for sensitive information
Common Issues and Troubleshooting
Even with a well-configured Google Analytics setup, you might encounter some issues. Here are solutions to common problems:
No data appearing in your reports
- Verify that the tracking code is properly installed on all pages
- Check if you have ad blockers or privacy extensions that might be blocking Google Analytics
- Ensure your filters aren’t excluding all traffic
- Remember that data can take up to 24-48 hours to fully process
Seeing your own visits in the data
Create an internal traffic filter to exclude your own IP address:
- Go to Admin > Data Settings > Data Filters
- Click “Create Filter”
- Select “Define filter” and choose “Internal traffic”
- Enter your IP address or IP range
- Save the filter
Discrepancies between Google Analytics and other tools
Different analytics tools measure data in different ways. Common reasons for discrepancies include:
- Different definitions of metrics (e.g., what counts as a “session”)
- Sampling in reports when dealing with large amounts of data
- Different tracking methodologies (cookie-based vs. server-side)
- Ad blockers affecting one tool but not another
Conclusion: Getting Started with Google Analytics in 2025
Google Analytics is a powerful tool that can provide invaluable insights into your website’s performance and your audience’s behavior. By following this beginner guide, you’ve learned how to set up Google Analytics, navigate its interface, understand key metrics, and interpret reports.
Remember that becoming proficient with Google Analytics is a journey. Start with the basics, focus on the metrics that matter most to your goals, and gradually explore more advanced features as you become comfortable with the platform.
The 2025 version of Google Analytics makes this journey easier than ever with its intuitive interface, AI-powered insights, and enhanced privacy features. By leveraging these capabilities, you’ll be well-equipped to make data-driven decisions that improve your website’s performance and help you achieve your business objectives.
Master Google Analytics with Our Complete Resource Kit
Get instant access to our comprehensive Google Analytics 2025 Beginner’s Resource Kit, including setup templates, custom dashboards, metrics cheat sheets, and video tutorials.
Frequently Asked Questions
Is Google Analytics free in 2025?
Yes, Google Analytics remains free for most users in 2025. The standard version provides all the features covered in this guide at no cost. There is also a premium version called Google Analytics 360 for enterprise-level businesses with advanced needs, which operates on a paid subscription model.
How does GA 2025 handle privacy laws?
Google Analytics 2025 includes several features designed to help with privacy compliance:
- Cookieless tracking options that rely less on personal identifiers
- Consent mode integration to respect user privacy choices
- Automatic IP anonymization
- Data retention controls to limit how long personal data is stored
- Data deletion capabilities to comply with user requests
However, it’s still your responsibility to ensure your use of Google Analytics complies with applicable laws in your region, such as GDPR in Europe or CCPA in California.
Can I import historical data?
Google Analytics 2025 provides limited options for importing historical data:
- If you’re migrating from a previous version of Google Analytics, some historical data may be available through the migration tool
- For data from other analytics platforms, you can import summary data using the Data Import feature, but not raw event-level data
- The Big Query Export feature (available in GA 360) allows for more flexible data handling and historical analysis
For most users, it’s best to start fresh with Google Analytics 2025 and maintain access to your old analytics platform for historical reference if needed.
How accurate is Google Analytics data?
Google Analytics data is generally reliable but not 100% accurate due to various factors:
- Ad blockers and privacy tools can prevent tracking for some users
- The cookieless tracking method uses statistical modeling which provides estimates rather than exact counts
- Sampling may be used in reports when dealing with large data sets
- Some users may clear cookies or use private browsing, affecting user and session counting
Despite these limitations, Google Analytics provides valuable insights when used to identify trends and patterns rather than focusing on exact numbers.
How often is Google Analytics data updated?
Data processing and availability in Google Analytics 2025 works as follows:
- Real-time reports show data from the last 30 minutes with minimal delay
- Standard reports are typically updated within a few hours
- Complete data processing, including advanced features like attribution models and audience definitions, may take up to 24-48 hours
- Some AI-powered insights and predictions are updated weekly based on accumulated data patterns
Also read: LeadsGuru Review 2025: Features, Pricing & Alternatives